Seven failures of economic liberalization
We’re all celebrating 25 years of the 1991 reforms, with good reason, but there are also several areas where our hopes have been belied
We’re all celebrating the 25th anniversary of the economic liberalization of 1991, with good reason. The end of the licence raj and the opening up of the economy to private and foreign capital has been a success story. But there are also several areas where our hopes have been belied. Here are a few of them:
Share of manufacturing in GDP%
One would have expected that the New Industrial Policy, unveiled in 1991, would have been just what the doctor ordered for the manufacturing sector and India would soon take its place among the manufacturing powers of East Asia. But chart 1 shows that in 1989-90, the share of manufacturing in the gross domestic product was 16.4%; in 2015-16, after myriad new manufacturing policies, its share was at 16.2%. True, this doesn’t mean the sector hasn’t grown. But since manufacturing holds out the promise of jobs for the masses and its productivity is also relatively higher, it was hoped that its share in the economy would increase. That hasn’t happened.

Combined fiscal deficit of centre and states
One underlying reason for the crisis of 1991 was the indiscriminate rise in government borrowing in earlier years. It was only to be expected therefore that after the crisis, the government would do all it could to curb its fiscal deficit and that of the states. Unfortunately, as chart 2 indicates, that didn’t happen. By 2000-01, the combined fiscal deficit of the centre plus the states, as a percentage of GDP, had risen beyond the 1991 level. In 2014-15, the combined fiscal deficit, as a percentage of GDP, was higher than it was in 1995-96.

Tax to GDP ratio
One reason why government deficits remained high is that, in spite of robust economic growth, tax revenues weren’t buoyant. Widespread tax evasion is probably the reason, along with a plethora of sops given to companies. Chart 3 shows that the central government’s gross tax revenues as a percentage of gross domestic product have remained below the 1991-92 level, in spite of recent efforts.

Central government expenditure
The disinclination to reduce the fiscal deficit had the effect of raising the central government’s interest burden, as it had to pay out ever-increasing interest on its outsize borrowings. The upshot was deterioration in the quality of the deficit. The government was borrowing to fund, not productive capital expenditure on infrastructure, but unproductive revenue expenses. The chart shows that in 1990-91, capital expenditure accounted for 30% of total central government expenditure. The budget for the current fiscal year puts the share of capex at a mere 12.5%.

Average employment per non-agricultural establishment
Economic liberalization has failed to provide secure and decent jobs to the mass of the population. Chart 5 shows that in spite of all the reforms, the number of employees per non-agricultural establishment has been coming down steadily. It was an average of 2.39 employees per establishment in the 2013 economic census, compared to 3.01 persons in the 1980 economic census. This means the vast majority of the establishments in India are in the informal sector, with neither the capital nor the technology to improve productivity.

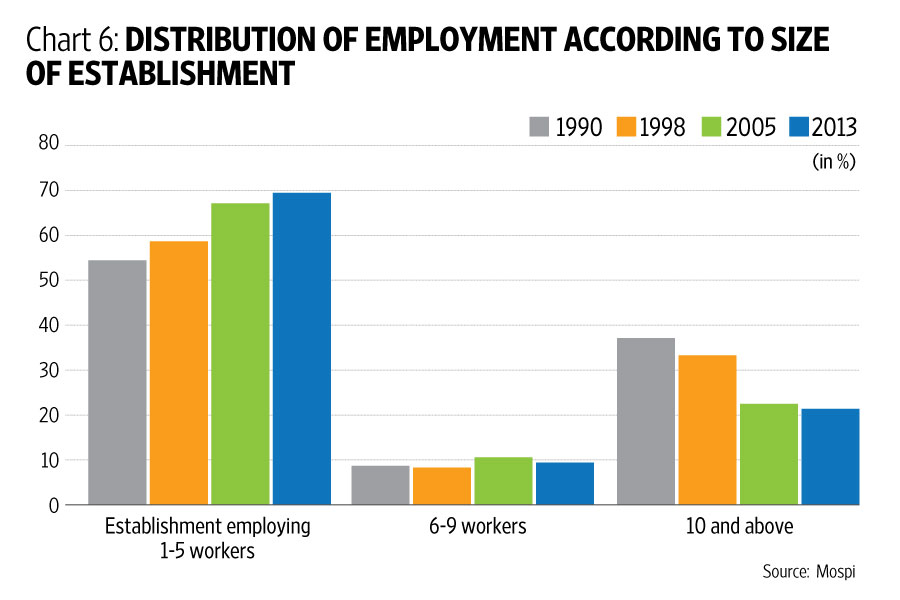
Distribution of employment according to size of employment
Before the 1991 liberalization, 37.11% of employees used to work in establishments employing 10 or more workers. Instead of increasing, that proportion has been steadily coming down and in 2013, only 21.15% of employees worked in establishments employing 10 or more workers. Workers in small enterprises for the most part eke out a precarious existence in the informal sector with no job security and precious few benefits.
Mortality rate
And finally, surely economic liberalization should result in better care for our children. Chart 7 shows the country has made considerable progress on that front, with the under-five mortality rate coming down from 125.8 per thousand in 1990 to 47.7 per thousand in 2015. But as the chart shows, neighbouring Bangladesh and Nepal, much poorer than India, have both brought down their under-five mortality rates more than India. The chart suggests you don’t really need to be the world’s fastest-growing major economy to ensure your kids survive.


No comments:
Post a Comment